
Seamless Interoperability: Dynamic Loading of FHIR Implementation Guides
Learn how to dynamically manage FHIR Implementation Guides (IGs) without restarting your server, ensuring your data models stay up to date.
FHIR
Implementation Guide
IG
In healthcare IT, a slow FHIR server isn’t just a technical nuisance—it can delay clinical care. If your API latency spikes, you need to know why before it impacts users. Is it a database connection pool exhaustion? A slow search parameter? Or a surge in requests?
To answer these questions, we need professional-grade observability. In this post, we’ll look at the integrated Prometheus and Grafana stack provided by hapi-fhir-groovy.
We use a modern observability pattern:
If you are using the repository’s docker-compose.yaml, the Prometheus and Grafana services are already defined. Simply start them:
make start-prometheus
Your FHIR server exposes metrics at the /actuator/prometheus endpoint. You can verify this by visiting http://localhost:8080/actuator/prometheus. You’ll see a list of metrics like:
fhir_request_latency_seconds: Time taken for FHIR operations.hikari_cp_active_connections: Database connection health.jvm_memory_used_bytes: Memory usage.Log in to Grafana at http://localhost:3000 (default: admin/admin).
The repository comes with pre-configured dashboards located in config/grafana. You’ll find:
Monitoring is only useful if it notifies you of problems. In Grafana, you can easily create an alert for high latency:
fhir_request_latency_seconds metric.Beyond standard JVM metrics, we expose specific HAPI FHIR “Pointcut” timings. This allows you to differentiate between:
By integrating observability directly into your FHIR infrastructure, you move from reactive troubleshooting to proactive management. You can define and track Service Level Objectives (SLOs), such as: “99.9% of Patient Reads must be under 150ms.”
In high-stakes healthcare environments, this data is your best friend during a post-mortem or a capacity planning meeting.
Explore the configuration files in config/grafana/.
Learn how to dynamically manage FHIR Implementation Guides (IGs) without restarting your server, ensuring your data models stay up to date.

How to implement structured, FHIR-native audit trails that satisfy HIPAA and GDPR requirements using the AuditEvent resource.

Learn how to extend your HAPI FHIR server at runtime using Groovy scripts, allowing for hot-reloadable Interceptors and Resource Providers.

How to move beyond static test data by combining the scale of Synthea with the precision of Flexporter to build realistic, custom healthcare environments.

Exploring the strategic value of Logical Models in FHIR architecture: when to use them, why they matter, and how to implement them using FHIR Shorthand (FSH).

A deep dive into the three powerful methods for including graphical representations in FHIR Implementation Guides: Mermaid, PlantUML, and the new automated Class Diagrams.
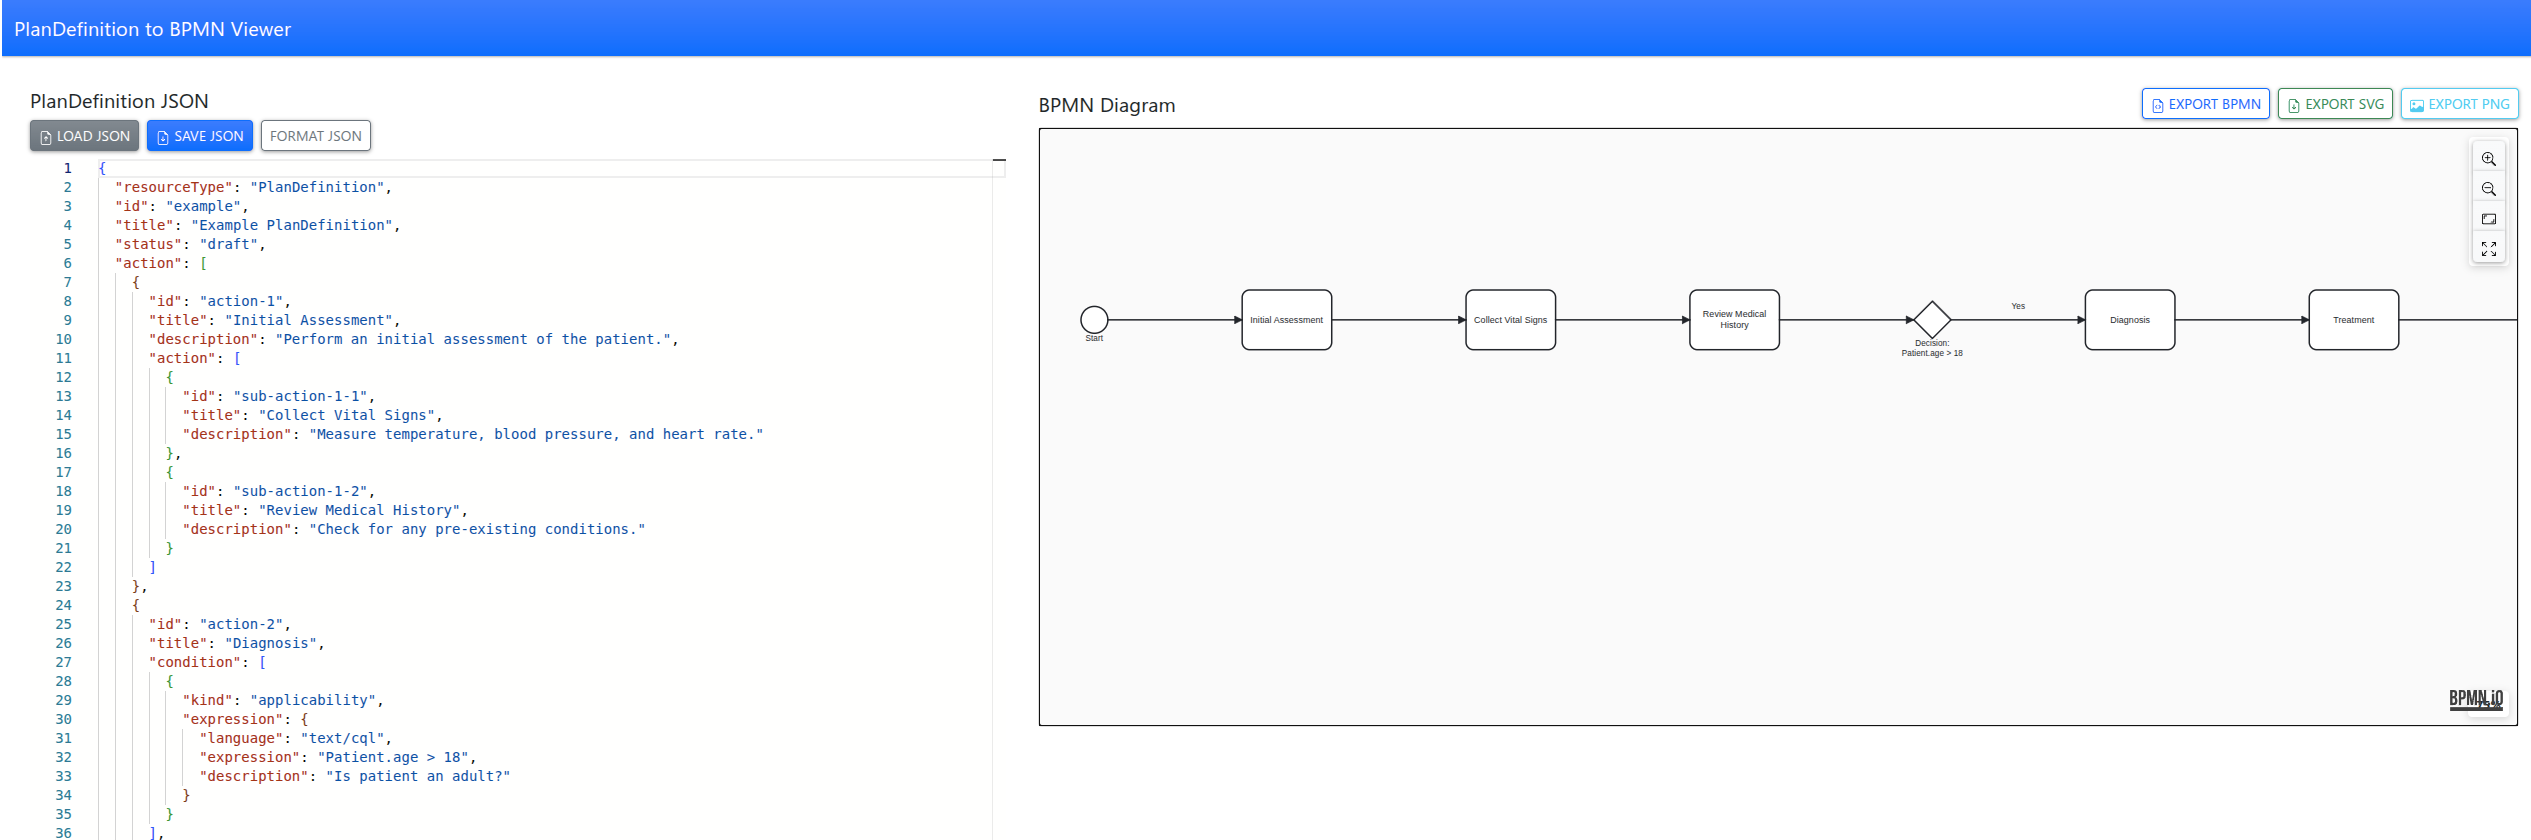
Tool to convert FHIR PlanDefinitions into interactive BPMN diagrams with a simple web app, making complex care pathways easy to visualize and understand.
A professional guide to converting FHIR resources into analytical Parquet files using dbt, enabling secure multi-tenant analytics with DuckDB.